Description
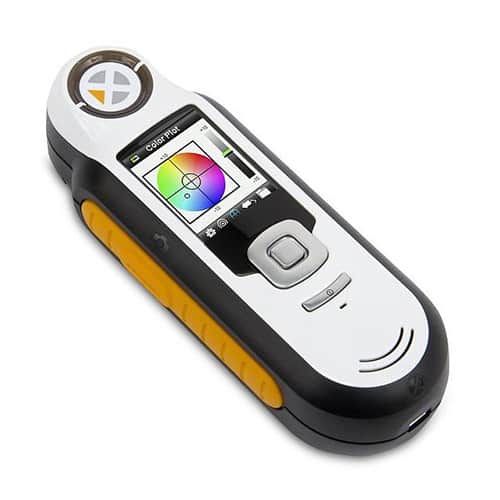
X-Rite RM200QC Spectrocolorimeter
Whats needed is a simple, reliable tool everyone can use.
The RM200QC is that tool. Lightweight, and easy to handle, the RM200QC comes ready to use. In barely more than a second you get a reading on your sample, and a report that tells you how close your color is to a measured standard. That’s it. You wont need to connect to a software program its all right at hand.
What this means for your color QC program is a clear advantage, one that allows you to.
● Achieve stable color quality throughout your manufacturing process
● Manage suppliers efficiently, each adhering to a single standard
● Control variations between lab formulation, production, and final goods
● Control batch variations
● Eliminate issues related to staff experience everyone uses the same device
RM200QC measures color accurately by taking images of your sample using 8 different visible illuminations and 1 UV LED (9 bands), an advantage over traditional colorimeters that typically have only three 3 bands (Red, Green, and Blue).
The unique imaging technology of RM200QC provides better agreement to visual observations through its 45/0 optical geometry and proprietary image capture technology. Each measurement is a combination of 27 images illuminated with different colors and from different directions. This takes just a little over a second and provides the device with information on color as well as on surface texture effects.
RMC200QC allows precise positioning on your sample, first for preview of the measurement area and then to store and recall the image after measurement.
RM200QC allows you to measure up to 20 reference standards and store these on the device, each date and time stamped with the option to name them using the onscreen keyboard.
A maximum of 350 sample measurements can be stored on the device and compared to the reference standards.
Test results are easily seen with:
● Graphical Pass/Fail indicator
● Display of dE for all common methods i.e. CIELAB, CMC, CIE 94, 2000
● Display of measured and delta differences with L*a*b*C*h for standard and sample
● Graphical L*a*b* plot
● Verbal color difference description
Tagging your samples either using the on screen keyboard for text or the built in voice recorder makes it easy to identify your measurements. If you need a more in-depth report, RM200QC automatically creates PDF and CSV files that can be accessed on your computer with the device set in the USB Report Mode. Its as simple as plugging in a memory stick!


